library(reticulate)Scrape GDP Table Pandas
Case Study
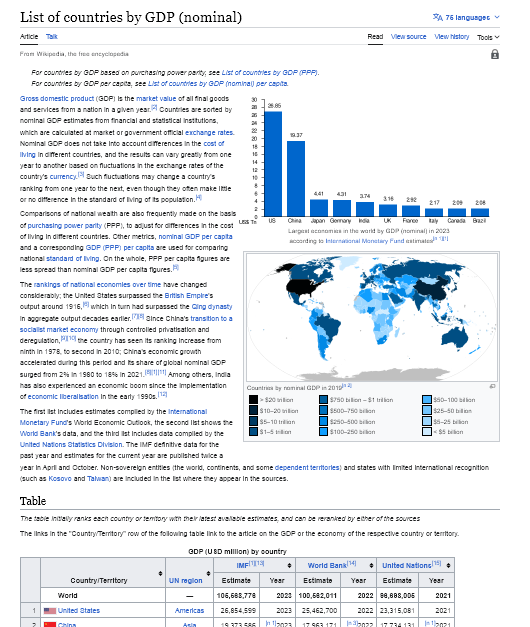
We’ll use pandas to directly scrape a data table from a webpage
- Create a script to scrape a table from an online site
- Need to extract the list of the top 10 largest economies of the world
- In descending order of their GDPs in Billion USD to 2 decimal places
- Data need to be supplied by the IMF (International Monetary Fund)
- Save the dataframe into a CSV file
- Site can be found here: https://web.archive.org/web/20230902185326/https://en.wikipedia.org/wiki/List_of_countries_by_GDP_%28nominal%29
Setup
import pandas as pd
import numpy as np
import matplotlib.pyplot as plt
import warnings
Data

read_html
Remember: read_html returns a list of DataFrame objects, even if there is only a single table contained in the HTML content
- The table we need is the one on the bottom so let’s read the page and save to tables
url = "https://web.archive.org/web/20230902185326/https://en.wikipedia.org/wiki/List_of_countries_by_GDP_%28nominal%29"
tables = pd.read_html(url)

# Since we know there are 3 tables on the page we can just choose the one we want
df = tables[3]
# As you can see here df1 is the world map data
df1 = tables[2]
df1.head(10) 0 ... 2
0 > $20 trillion $10–20 trillion $5–10 trillion ... ... $50–100 billion $25–50 billion $5–25 billion <...
[1 rows x 3 columns]# Here is a quick look at our data to make sure it is the correct table
df.head(10) Country/Territory UN region ... United Nations[15]
Country/Territory UN region ... Estimate Year
0 World — ... 96698005 2021
1 United States Americas ... 23315081 2021
2 China Asia ... 17734131 [n 1]2021
3 Japan Asia ... 4940878 2021
4 Germany Europe ... 4259935 2021
5 India Asia ... 3201471 2021
6 United Kingdom Europe ... 3131378 2021
7 France Europe ... 2957880 2021
8 Italy Europe ... 2107703 2021
9 Canada Americas ... 1988336 2021
[10 rows x 8 columns]Shape
# let's see the shape of the table: a tuple(214 rows with 8 columns)
df.shape
(214, 8)# so we know the range of the columns, the second element of the tuple is 0:8
range(df.shape[1])range(0, 8)Columns

- If you look at the image, you can see that once you get past column 2 each pair of columns is grouped together
- You can see that in the list below: IMF appears twice, so does World Bank, United Nations
df.columnsMultiIndex([( 'Country/Territory', 'Country/Territory'),
( 'UN region', 'UN region'),
( 'IMF[1][13]', 'Estimate'),
( 'IMF[1][13]', 'Year'),
( 'World Bank[14]', 'Estimate'),
( 'World Bank[14]', 'Year'),
('United Nations[15]', 'Estimate'),
('United Nations[15]', 'Year')],
)Convert Columnnames
- To avoid confusion let’s just rename all the colums by their position in the range 0:8
df.columns = range(df.shape[1])

# Let's look at the head once again to make sure it's right
df.head(5)
0 1 2 ... 5 6 7
0 World — 105568776 ... 2022 96698005 2021
1 United States Americas 26854599 ... 2022 23315081 2021
2 China Asia 19373586 ... [n 3]2022 17734131 [n 1]2021
3 Japan Asia 4409738 ... 2022 4940878 2021
4 Germany Europe 4308854 ... 2022 4259935 2021
[5 rows x 8 columns]Extract Columns
- As requested we are only interested in the name of the country column [0]
- And the GDP for that country column [2]
- So let’s extract them
df = df[[0,2]]
df.head(5)
0 2
0 World 105568776
1 United States 26854599
2 China 19373586
3 Japan 4409738
4 Germany 4308854Sort Descending
- It appears that column 2 is sorted in descending order but you always need to check and
- sort it yourself
df = df.sort_index(axis=1)
df.head(11)
0 2
0 World 105568776
1 United States 26854599
2 China 19373586
3 Japan 4409738
4 Germany 4308854
5 India 3736882
6 United Kingdom 3158938
7 France 2923489
8 Italy 2169745
9 Canada 2089672
10 Brazil 2081235Extract Top 10
- Remember we wanted to top 10 countries
- If you look at the df you’ll notice the first row is the entire World’s GDP
- So we need to extract rows 1:11
df = df.iloc[1:11,:]Rename Columns
df.columns = ["Country", "GDP (Millions USD)"]
df
Country GDP (Millions USD)
1 United States 26854599
2 China 19373586
3 Japan 4409738
4 Germany 4308854
5 India 3736882
6 United Kingdom 3158938
7 France 2923489
8 Italy 2169745
9 Canada 2089672
10 Brazil 2081235Type
# Let's check the type of data in the df
df.dtypes
Country object
GDP (Millions USD) object
dtype: objectConvert Type
- We are supposed to have the GDP in Billions of USD not Millions
- In order to do that we need to convert the data type to int
- Come to think of it we should’ve done that before we renamed the columns !!!
df['GDP (Millions USD)'] = df['GDP (Millions USD)'].astype(float)df.dtypesCountry object
GDP (Millions USD) float64
dtype: objectRound Column
- Let’s convert to Billions
- Round to 2 decimals
df['GDP (Millions USD)'] = df['GDP (Millions USD)']/1000

# note the [[ ]]
df[['GDP (Millions USD)']] = df[['GDP (Millions USD)']]/1000

# set decimal points
df[['GDP (Millions USD)']] = np.round(df[['GDP (Millions USD)']],2)
# rename column to Billions
df.rename(columns = {'GDP (Millions USD)' : 'GDP (Billions USD)'}) Country GDP (Billions USD)
1 United States 26.85
2 China 19.37
3 Japan 4.41
4 Germany 4.31
5 India 3.74
6 United Kingdom 3.16
7 France 2.92
8 Italy 2.17
9 Canada 2.09
10 Brazil 2.08Save to CSV
df.to_csv('./filename')