Viz - Google Looker Studio
In the last section we created the reports we specifically designed the DW to be able to answer with ease, in this section we’ll create a dashboard using Google Looker Studio
Objectives
I’ll be working this section in the Google Looker Studio using the same data that we used in the IBM Cognos Viz
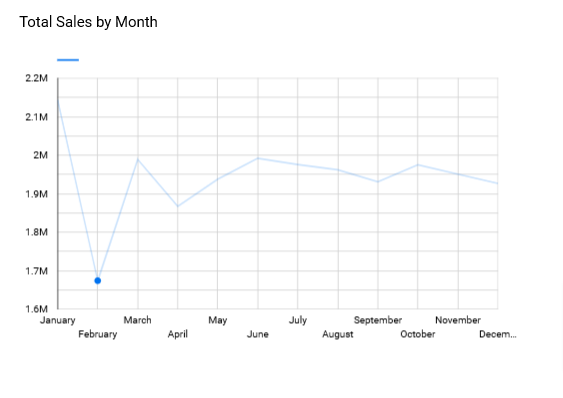
- A line chart of total sales per month for the year 2020
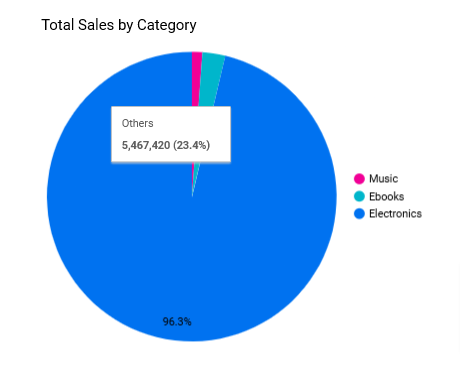
- A pie chart of total sales for each category
- A bar chart of quarterly sales of mobile phones
Data
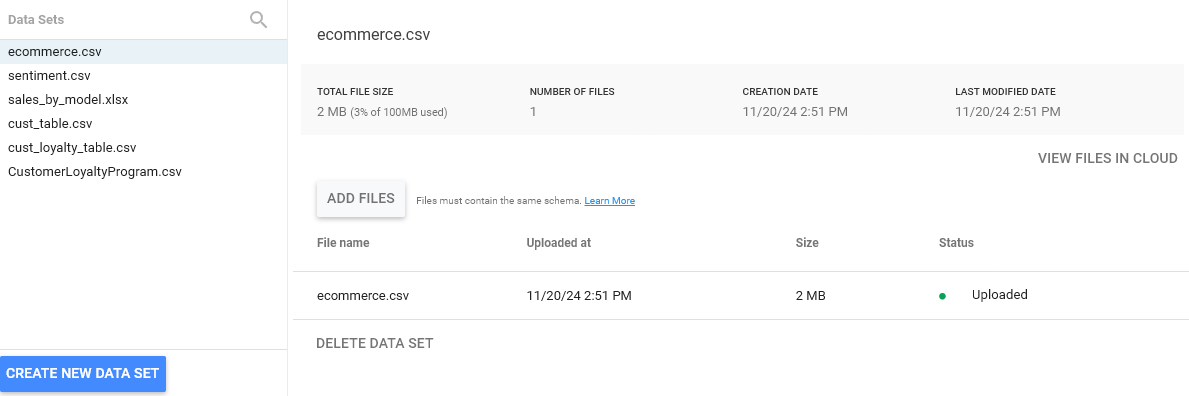
I’ll download the data from online to a local drive named: ecommerce.csv. Login to Looker Studio at Google Looker Studio
Import Data into Looker Studio
- Fairly simple process, in Looker
- Connectors are used by data sources and since we have our data locally we choose
- Left side click on +
- Create Data Source
- Create File Upload
- Drag file
- Here you see the file done uploaded to Studio
- Once done click CONNECT in upper right corner
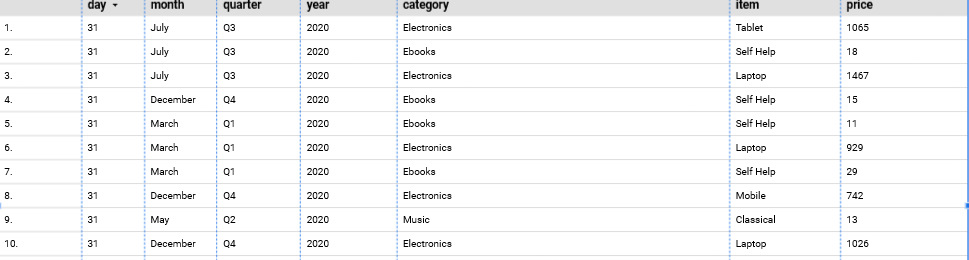
List First 10 rows
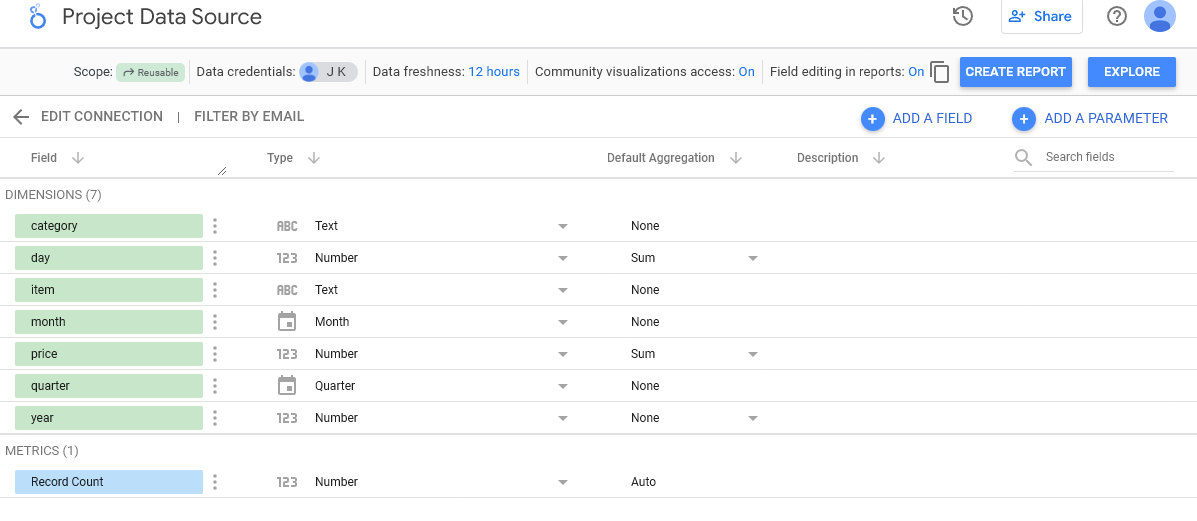
Create DataSource
- This is done as part of importing data above
Line Chart
- Create a line chart of month wise total sales for the year 2020.
Pie Chart
- Create a pie chart of category wise total sales.
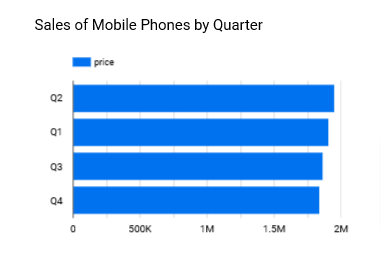
Bar Chart
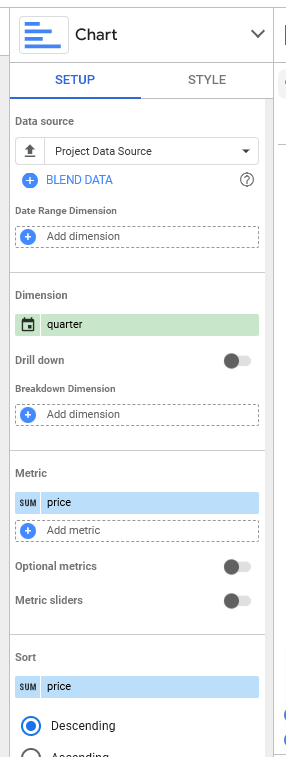
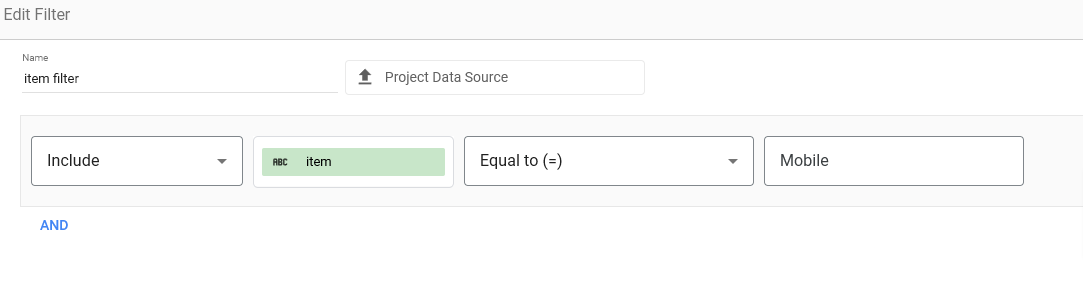
- Create a bar chart of Quarterly sales of mobile phones
- Setup the fields, sort, and filter as such