library(reticulate)Banks Table - BS - CSV - SQLite3 - Log
This example will demonstrate an ETL of scraping a webpage displaying Bank Values. The process involves using BeautifulSoup to extract the necessary table, transform the data, load the data into a csv file, and a SQLite3 db, run exploratory queries, and save the progress in a log file
Case Study
- We are asked to create a code that can be used to compile the list of the top 10 largest banks in the world ranked by market capitalization in billion USD.
- The data needs to be transformed and stored in GBP, EUR and INR as well, in accordance with the exchange rate information that has been made available in a CSV file
- The processed information table is to be saved locally in a CSV format and as a database table
- Run queries on the db
- Log all function call in a progress log file
Your job is to create an automated system to generate this information so that the same can be executed in every financial quarter to prepare the report.
Setup
- Let’s start by loading the libraries and
- Setting the global variables
from bs4 import BeautifulSoup
import pandas as pd
import numpy as np
import sqlite3
import requests
from datetime import datetime
# Global Vars
url = 'https://web.archive.org/web/20230908091635%20/https://en.wikipedia.org/wiki/List_of_largest_banks'
exchange_file = 'https://cf-courses-data.s3.us.cloud-object-storage.appdomain.cloud/IBMSkillsNetwork-PY0221EN-Coursera/labs/v2/exchange_rate.csv'
sql_connection = sqlite3.connect('D:/data/BANK/Banks.db')
transformed_file = 'D:/data/BANK/Largest_banks_data.csv'
table_name = 'Largest_banks'
attribute_list = ['Name','MC_USD_Billion']
log_file = 'D:/data/BANK/code_log.txt'Task 1: Logging function
Write the function to log the progress of the code, log_progress().
- The function accepts the message to be logged and enters it to a text file
code_log.txt - The log file will save the timestamp and the message generated by every process done
- Here is a list of the messages we need to save upon execution
| Task | Log message on completion |
|---|---|
| Declaring known values | Preliminaries complete. Initiating ETL process |
| Call extract() function | Data extraction complete. Initiating Transformation process |
| Call transform() function | Data transformation complete. Initiating Loading process |
| Call load_to_csv() | Data saved to CSV file |
| Initiate SQLite3 connection | SQL Connection initiated |
| Call load_to_db() | Data loaded to Database as a table, Executing queries |
| Call run_query() | Process Complete |
| Close SQLite3 connection | Server Connection closed |
Code
# Logging Function
def log_progress(message):
        timestamp_format = '%Y-%h-%d-%H:%M:%S' # Year-Monthname-Day-Hour-Minute-Second
        now = datetime.now() # get current timestamp
        timestamp = now.strftime(timestamp_format)
        with open(log_file,"a") as f:
                f.write(timestamp + ',' + message + '\n')
Task 2 : Extraction of data
Analyze the webpage on the given URL:
- Identify the position of the required table under the heading
By market capitalization. - Write the function
extract()to retrieve the information of the table to a Pandas data frame. - Note: Remember to remove the last character from the
Market Capcolumn contents, like, ‘\n’, and typecast the value to float format. - Write a function call for
extract()and print the returning data frame. - Make the relevant log entry.
HTML Structure Inspection
- I’ll first do a visual inspection of the webpage using the inspect option on the browser just to get a general idea of the layout
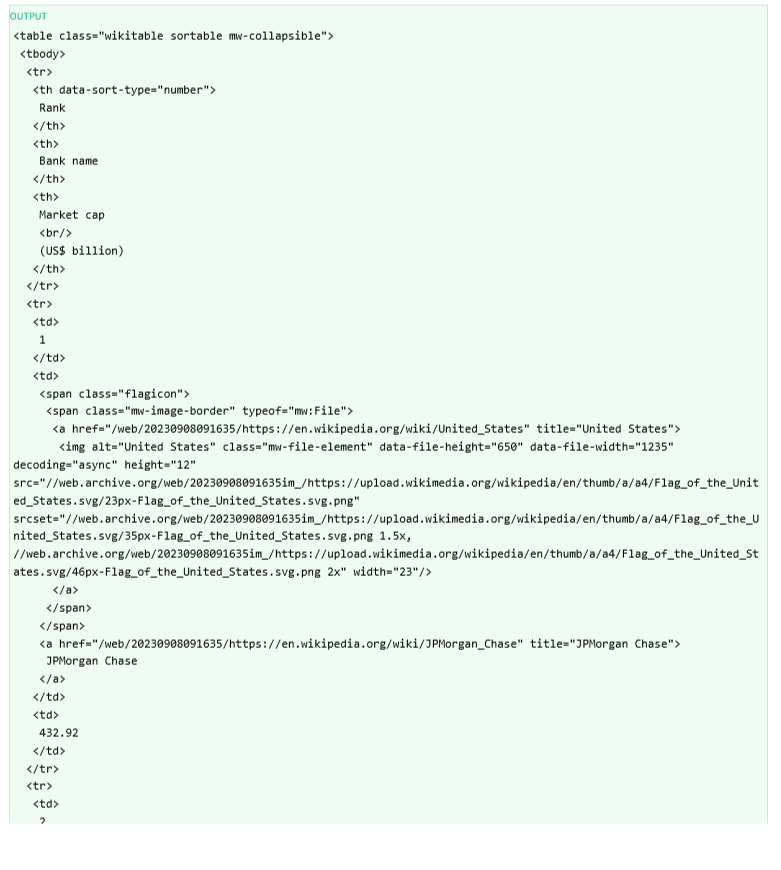
- It appears from the page that the table we need is the first of 3 on that page. But to be sure I’ll go ahead and create a BS object and review it after parsing it.
- I’ll go ahead and print out part of the HTML structure
data = rquests.get(url).text
page = BeautifulSoup(data, 'html5lib')
tables = page.find_all('table')
table = tables[0]
rows = table.find_all('tr')
print(table.prettify())
- As you see above it is the correct table so let’s drill into the rows
'tr' - So here below we’ll find all the rows and iterate through all the rows and target the columns
'td' - I’ll print out the contents of each column in each row so we can identify the data we need
- As you can see we are interested in col[1] and col[2]
- col[1] we need to focus on the contents of the
<a> </a> - By looking at the output above you can see there are multiple tags in the second column value.
- So let’s list them all for each row and see if the table is consistent, that way we’ll know which title to extract for our study
- From the results below we can tell that the table is consistently displaying the Bank Name as the second title in the row
data = requests.get(url).text
page = BeautifulSoup(data, 'html5lib')
tables = page.find_all('table')
table = tables[0]
rows = table.find_all('tr')
data_dict = {}
df = pd.DataFrame(columns = attribute_list)
for x, row in enumerate(rows):
        col = row.find_all('td')
        if len(col) != 0:
                print(f"We are in row {x}")
                print(f"content 0 is: {col[0].contents}")
                print(f"content 1 is: {col[1].contents}")
                print(f"content 2 is: {col[2].contents}")
"""
content 0 is: ['1\n']

content 1 is: [<span class="flagicon"><span class="mw-image-border" typeof="mw:File"><a href="/web/20230908091635/https://en.wikipedia.org/wiki/United_States" title="United States"><img alt="United States" class="mw-file-element" data-file-height="650" data-file-width="1235" decoding="async" height="12" src="//web.archive.org/web/20230908091635im_/https://upload.wikimedia.org/wikipedia/en/thumb/a/a4/Flag_of_the_United_States.svg/23px-Flag_of_the_United_States.svg.png" srcset="//web.archive.org/web/20230908091635im_/https://upload.wikimedia.org/wikipedia/en/thumb/a/a4/Flag_of_the_United_States.svg/35px-Flag_of_the_United_States.svg.png 1.5x, //web.archive.org/web/20230908091635im_/https://upload.wikimedia.org/wikipedia/en/thumb/a/a4/Flag_of_the_United_States.svg/46px-Flag_of_the_United_States.svg.png 2x" width="23"/></a></span></span>, ' ', <a href="/web/20230908091635/https://en.wikipedia.org/wiki/JPMorgan_Chase" title="JPMorgan Chase">JPMorgan Chase</a>, '\n']

content 2 is: ['432.92\n']
"""- You should also notice that the Bank Names are within the
'a'tags - So let’s edit our code to target the ‘a’ tag and the title for the Bank Name
- And contents for the Capitalization value
- All we need to do is skip the first ‘title’ value and target the second
- So let’s edit the code and save the values into a dict first then into a df
for x, row in enumerate(rows):
        col = row.find_all('td')
        if len(col) != 0:
                print(f"We are in row {x}")
                if col[1].find_all('a') is not None:
                        for x in col[1].find_all('a'):
                                print(f"content 1 titles are: {x.get('title')}")
                        print(f"content 2 is: {col[2].contents[0]}")

"""
We are in row 1
content 1 titles are: United States
content 1 titles are: JPMorgan Chase
content 2 is: 432.92

We are in row 2
content 1 titles are: United States
content 1 titles are: Bank of America
content 2 is: 231.52

We are in row 3
content 1 titles are: China
content 1 titles are: Industrial and Commercial Bank of China
content 2 is: 194.56

We are in row 4
content 1 titles are: China
content 1 titles are: Agricultural Bank of China
"""- So let’s revise the code to capture the second title
a_count[1]['title'] - For the Market Capitalization value we need
col[2].contents[0]but notice the at the end so we have to start from the end after skipping 1char col[2].contents[0][:-1] - We then save the data in a dict which is saved in df1
- We have already created a df and initialized it with the column names using the attribute_list
- We concatenate df with df1 into df which will contain all the columns and rows we extracted from the webpage
- The function will return the df to the caller
Code
# Extract Function
def extract(url,attribute_list):
        data = requests.get(url).text
        page = BeautifulSoup(data, 'html5lib')
        #print(page.prettify())
        tables = page.find_all('table')
        table = tables[0]
        rows = table.find_all('tr')
        data_dict = {}
        df = pd.DataFrame(columns = attribute_list)
        for row in rows:
                col = row.find_all('td')
                if len(col) != 0:
                        a_count = col[1].find_all('a')
                        if a_count != 0:
                                data_dict = {'Name' : a_count[1]['title'] ,
                                'MC_USD_Billion' :  col[2].contents[0][:-1]}
                                df1 = pd.DataFrame(data_dict, index = [0])
                                df = pd.concat([df, df1], ignore_index = True)
        return df
Task 3 : Transformation of data
The Transform function needs to perform the following tasks:
- Read the exchange rate CSV file
- Convert the contents to a dictionary so that the contents of the first columns are the keys to the dictionary and the contents of the second column are the corresponding values
- Add 3 additional columns for different exchanges
Exchange Rate Function
- Here we’ll import the exchange rate factors
- Save into a df
- Convert df to a dictionary
- Return dict to
transform()function for computation
reference: loop through dict
- This is for reference only while I’m here.
- I’ll include this part in another part of the pandas section
# This is one way to loop through a dict to see all the keys
for key in rate:
        print(key, rate[key])

Can use list.keys
# another way to extract values
x = 0
for key in rate:
        rate[key] = exchange_df.iloc[x,0]
        rate[key] = exchange_df.iloc[x,1]
        x = x + 1

rate
df to dict - method 1
# this is another example of how to transform 2 df cols to dict
def get_exchange_rate(filename):
        exchange_df = pd.read_csv(filename)
        df_dict = exchange_df.set_index('Currency')['Rate'.to_dict()]
        return df_dict
Exchange Rate method 2
- Instead of using a dictionary as we see above and below (the two methods)
- We can use the df directly like this
# Use this if you wish to use a df as the rate exchange multiplier source

def transform(df, multiplier):
        df['MC_USD_Billion'] = df['MC_USD_Billion'].astype(float)
        df['MC_GBP_Billion'] = [np.round(x * multiplier.iloc[1,1],2) for x in df['MC_USD_Billion']]
        df['MC_EUR_Billion'] = [np.round(x * multiplier.iloc[0,1],2) for x in df['MC_USD_Billion']]
        df['MC_INR_Billion'] = [np.round(x * multiplier.iloc[2,1],2) for x in df['MC_USD_Billion']]
        return df

# use these two lines in the Call Function code to call the transform function using the df instead

df = transform(df, exchange_df)
Code
df to dict - method 2
# Import and convert exchange rate
def get_exchange_rate(filename):
        exchange_df = pd.read_csv(filename)
        df_dict = dict(zip(exchange_df['Currency'],exchange_df['Rate']))
        return df_dict
# Call exchange rate function and use values for transformation
def transform(df):
exchange_rate = get_exchange_rate(exchange_file)
df['MC_USD_Billion'] = df['MC_USD_Billion'].astype(float)
df['MC_GBP_Billion'] = [np.round(x * exchange_rate['GBP'],2) for x in df['MC_USD_Billion']]
df['MC_EUR_Billion'] = [np.round(x * exchange_rate['EUR'],2) for x in df['MC_USD_Billion']]
df['MC_INR_Billion'] = [np.round(x * exchange_rate['INR'],2) for x in df['MC_USD_Billion']]
return dfTask 4: Loading to CSV
- Write the function to load the transformed data frame to a CSV file, like
load_to_csv(), in the path mentioned in the project scenario - Make the relevant log entry
Code
def load_to_csv(df, csv_path):
        df.to_csv(csv_path)
Task 5: Loading to Database
Write the function to load the transformed data frame to an SQL database, like, load_to_db().
- Before calling this function, initiate the connection to the SQLite3 database server
- Pass this connection object, along with the required table name
Largest_banksand the transformed data frame, to theload_to_db()function in the function call
Code
def load_to_db(df, sql_connection, table_name):
        df.to_sql(table_name, sql_connection, if_exists = 'replace', index =False)
        print('Table is loaded with data')
Task 6: Run queries
- Write the function
run_queries()that accepts the query statement, and the SQLite3 Connection object, and generates the output of the query. - The query statement should be printed along with the query output.
Code
def run_query(query_statement, sql_connection):
    print(query_statement)
    query_output = pd.read_sql(query_statement, sql_connection)
    print(query_output)
Task 7: Run ETL
Finally we get to
- Call all the functions
- Run our queries
- Log the progress
# Logging Function
log_progress('Preliminaries complete. Initiating ETL process')
df = extract(url, attribute_list)

log_progress('Data extraction complete. Initiating Transformation process')
df = transform(df)

log_progress('Data transformation complete. Initiating loading process')

load_to_csv(df, transformed_file)

log_progress('Data saved to CSV file')

log_progress('SQL Connection initiated.')

load_to_db(df, sql_connection, table_name)

log_progress('Data loaded to Database as table. Executing queries')

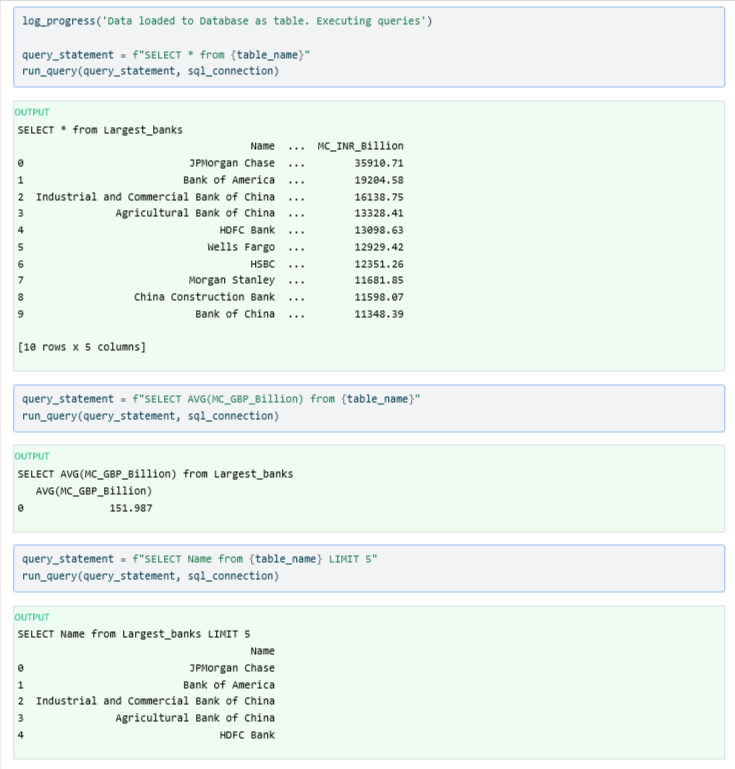
# ----------- Run these Queries ------------------
query_statement = f"SELECT * from {table_name}"
run_query(query_statement, sql_connection)

query_statement = f"SELECT AVG(MC_GBP_Billion) from {table_name}"
run_query(query_statement, sql_connection)

query_statement = f"SELECT Name from {table_name} LIMIT 5"
run_query(query_statement, sql_connection)

log_progress('Process Complete.')

sql_connection.close()
log_progress('Server Connection Closed')
Task 8: Review Output
transform() - Output
df = extract(url, attribute_list)
df = transform(df)
df['MC_EUR_Billion'][4]
# OUTPUT 146.86| Name | MC_USD_Billion | MC_GBP_Billion | MC_EUR_Billion | MC_INR_Billion | |
|---|---|---|---|---|---|
| 1 | JPMorgan Chase | 432.92 | 346.34 | 402.62 | 35910.71 |
| 2 | Bank of America | 231.52 | 185.22 | 215.31 | 19204.58 |
| 3 | Industrial and Commercial Bank of China | 194.56 | 155.65 | 180.94 | 16138.75 |
| 4 | Agricultural Bank of China | 160.68 | 128.54 | 149.43 | 13328.41 |
| 5 | HDFC Bank | 157.91 | 126.33 | 146.86 | 13098.63 |
| 6 | Wells Fargo | 155.87 | 124.70 | 144.96 | 12929.42 |
| 7 | HSBC | 148.90 | 119.12 | 138.48 | 12351.26 |
| 8 | Morgan Stanley | 140.83 | 112.66 | 130.97 | 11681.85 |
| 9 | China Construction Bank | 139.82 | 111.86 | 130.03 | 11598.07 |
| 10 | Bank of China | 136.81 | 109.45 | 127.23 | 11348.39 |
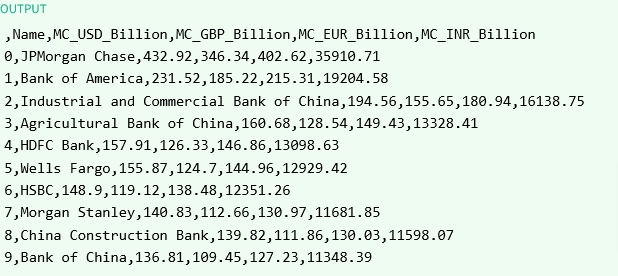
csv file - Output
with open(transformed_file, 'r') as f:
        material = f.read()
        print(material)
run_query() - Output

CSV image of the log.txt file
with open(log_file, 'r') as f:
        material = f.read()
        print(material)